
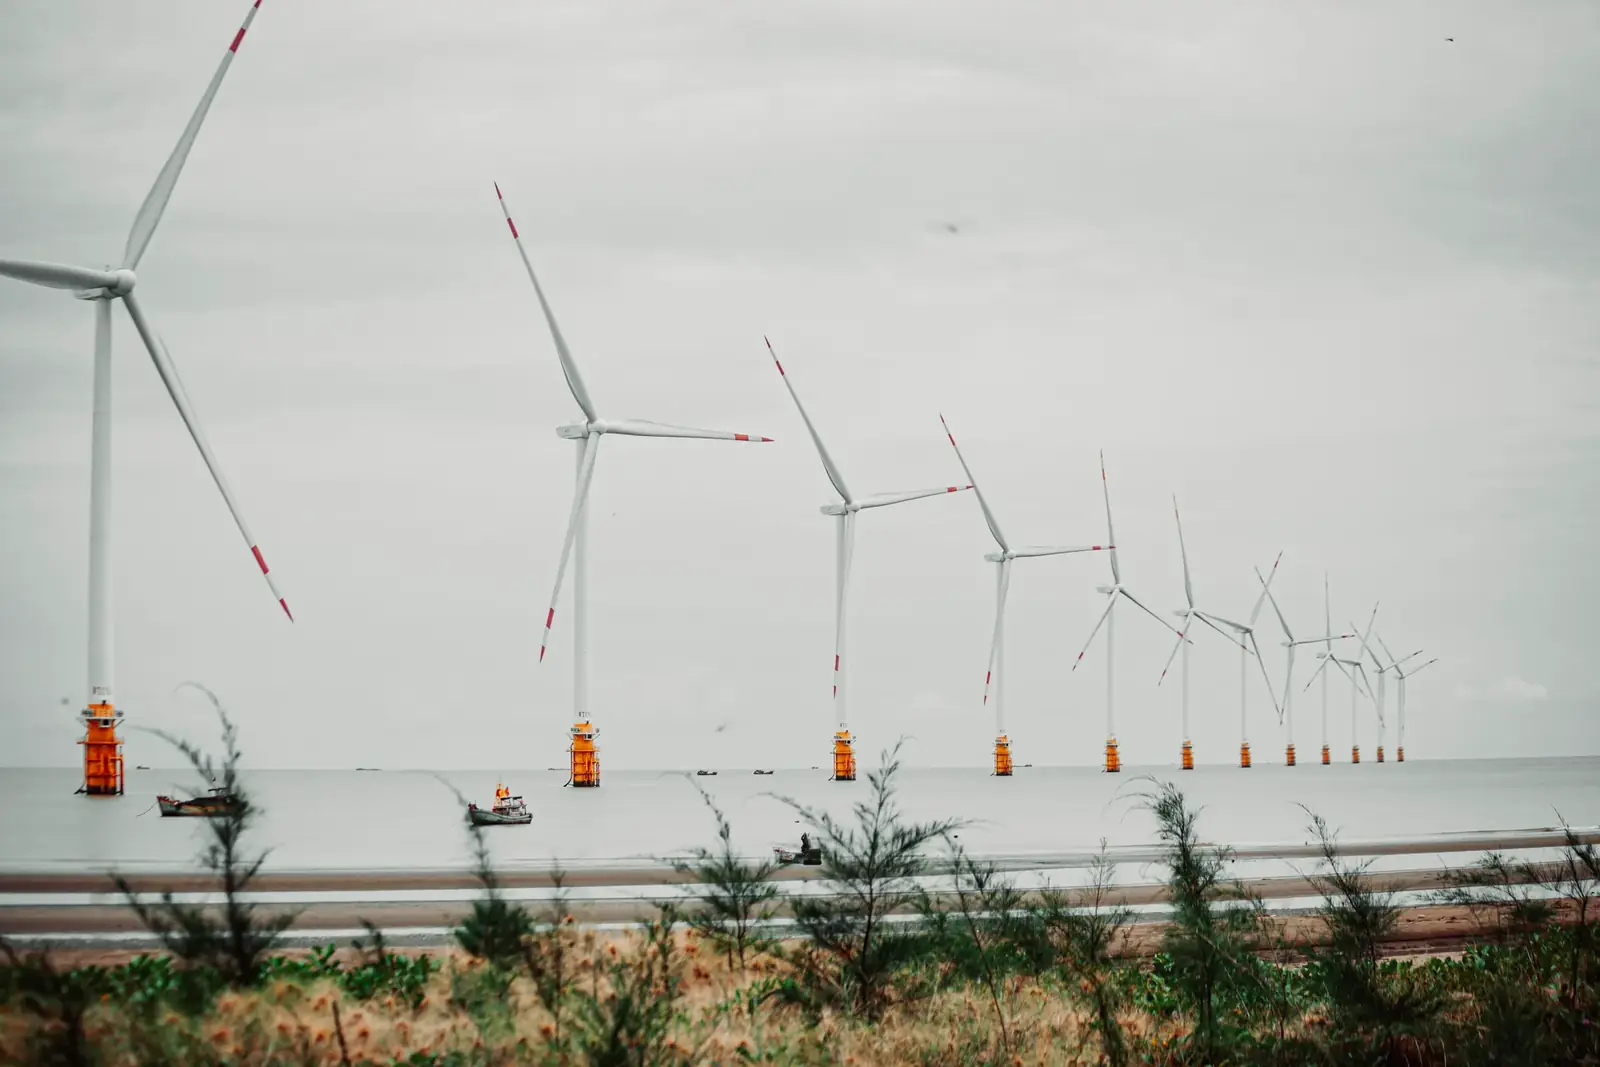
Wind energy is now a cornerstone of Britain’s power system. In 2025, wind turbines generated 86.4 terawatt-hours (TWh) of electricity, accounting for about 29.4% of the UK’s total generation. That is well over a quarter of all the electricity generated in the country. In the first quarter of 2026, wind’s share was about 35.5%, a sign that wind is no longer a niche renewable but a mainstream part of the national grid.
This shift is not accidental. It is the result of large-scale investment in offshore wind farms, government support through Contracts for Difference auctions, and the lifting of the de facto onshore wind ban in England. Yet the technology comes with trade-offs. Wind is variable, the grid is under strain, and the environmental impact on birds and landscapes is real. This guide explains how wind turbines work, how much power they produce, and what the future holds for wind energy in Britain.
How wind turbines generate electricity
A wind turbine is a machine that converts the kinetic energy of moving air into electricity. It does this through a simple chain of physical events: wind turns the rotor blades, the rotor turns a shaft, and a generator inside the nacelle (the housing on top of the tower) produces electricity.
Modern turbines are sophisticated pieces of engineering. Large turbines pitch their blades and yaw the nacelle so that the rotor faces into the wind. There are two main drivetrain designs. A geared turbine uses a gearbox to step the slow rotation of the blades up to a faster speed suitable for the generator. A direct-drive turbine connects the rotor straight to a large, slow-turning generator, eliminating the gearbox entirely. The Siemens Gamesa SG 14-236 DD, chosen for the Hornsea 3 project, is a direct-drive machine with a 236-metre rotor diameter.
The physics of wind energy are unforgiving. The power available in the wind is proportional to the cube of the wind speed. If wind speed doubles, the available power increases by roughly eight times, which is why choosing a location for wind turbines matters so much. Power is also proportional to the swept area of the blades. Doubling the blade length quadruples the area, and thus the power potential. This is why turbine blades are getting so long. A larger rotor captures more energy, but it also requires a taller tower to reach stronger, less turbulent winds at higher altitudes.
No turbine can capture all the energy in the wind. The Betz limit, established in 1919, states that a turbine can capture a maximum of 59.3% of the kinetic energy passing through its rotor. No real turbine can break that physical ceiling.
Turbines operate within specific wind speed ranges. They start generating power at a cut-in speed, reach full rated output at a rated speed, and shut down at a cut-out speed to protect themselves from storms. For example, the Vestas V163-4.5 MW cuts in at 3 m/s and cuts out at 24 m/s.
The global picture for wind power
In 2025, a record 165 gigawatts (GW) of new wind capacity was connected worldwide, a 40% increase on 2024. Onshore wind accounted for 155.3 GW of this, while offshore wind added 9.3 GW. Cumulative global capacity reached 1,299 GW by the end of 2025, spanning 138 countries.
China remains the dominant market, adding 120.5 GW in 2025 to bring its total to 640.5 GW. The USA, India, Germany and Brazil were the next-largest markets. Europe added 19.1 GW in 2025, passing 300 GW of total capacity. The Global Wind Energy Council (GWEC) projects that 969 GW of new capacity will be added between 2026 and 2030, potentially pushing global capacity past 2 terawatts by 2029-2030.
According to the International Renewable Energy Agency (IRENA), new onshore wind was the cheapest new renewable electricity in 2024, with a global weighted average levelised cost of electricity (LCOE) of USD 0.034 per kWh. Offshore wind was more expensive at USD 0.079 per kWh. Europe’s onshore average was higher at USD 0.051 per kWh.
The UK picture: capacity, records, and policy
The UK is one of the two biggest builders of offshore wind: according to RenewableUK, China and the UK made up 84% of the offshore capacity that came online worldwide in the 12 months to March 2026. The national picture splits into two distinct datasets: DESNZ covers the UK (including Northern Ireland), while NESO covers Great Britain (England, Scotland, Wales).
Capacity and generation
At the end of 2025, the UK had 33.1 GW of wind capacity: 16,431 MW onshore and 16,650 MW offshore (including 79.6 MW floating). By the end of Q2 2026, this had risen to 33.6 GW. The vast majority of offshore capacity is fixed-bottom; UK floating capacity has not changed since 2021.
In 2025, wind generated 86.4 TWh of electricity. This represented about 29.4% of total UK generation. A first estimate in April 2026 had suggested a record 30.0% share, but the revised figures from the government’s Energy Trends report settled at 29.4%. Onshore contributed 34.4 TWh (11.7%) and offshore contributed 52.0 TWh (17.7%). All renewables combined generated 52.1% of UK electricity in 2025.
Scotland is the engine of onshore wind, producing 22.0 TWh in 2025, which is 64% of the UK onshore total. England dominates offshore generation, producing 41.1 TWh, or 79% of the UK offshore total.
Records and load factors
Britain set a new wind output record on Wednesday 25 March 2026, with wind turbines generating 23,880 MW, confirmed by NESO. This beat the previous record of 23,825 MW set on 5 December 2025. During that record window, wind supplied more than half of Britain’s electricity, and earlier that day gas fell to about 2.3% of supply.
Load factors (capacity factors) vary significantly by season and location. In 2025, the UK offshore load factor was 36.4%, while onshore was 24.1%. Wind is stronger in winter: in Q4 2025, the offshore load factor hit 48.3%, compared to just 29.1% in Q2 2025.
Major offshore wind farms
The UK is home to some of the world’s largest wind farms. Hornsea 1 (1.2 GW) and Hornsea 2 (1.3 GW) are operational off the Yorkshire coast. Hornsea 3, a 2.9 GW project using Siemens Gamesa turbines, reached a final investment decision in December 2023 and is expected to be completed around the end of 2027. Its sister project, Hornsea 4 (2.4 GW), was dropped: in May 2025 Ørsted said it would discontinue it in its current form, citing higher supply chain costs, interest rates and risk.
The Dogger Bank Wind Farm, a joint venture between SSE Renewables, Equinor, and Vårgrønn, comprises three phases (A, B, and C) totalling 3.6 GW. All 277 foundations were installed by November 2025, and all 95 turbines at Dogger Bank A were in place by early February 2026, with commissioning expected to be completed later in 2026. Turbine installation at Dogger Bank B began in March 2026. Dogger Bank South, a separate project of about 3 GW owned by RWE and Masdar, received development consent in May 2026.
Floating offshore wind is still in its infancy. Hywind Scotland, the world’s first floating wind farm, has 30 MW of capacity. It uses spar-type floating substructures in water 95-120 metres deep. Kincardine, off Aberdeen, uses WindFloat semi-submersible platforms and has a capacity of about 50 MW. Equinor reports a 54% average capacity factor for Hywind over its first five years, but that is an operator claim; the UK offshore average load factor is typically about 36-46%.
Policy and planning
The government’s Clean Power 2030 Action Plan, published in December 2024, set ambitious targets: 43-50 GW of offshore wind, 27-29 GW of onshore wind, and 45-47 GW of solar by 2030. Against capacity at the end of Q2 2026, this implies adding roughly 26-33 GW of offshore wind and 10-12 GW of onshore wind in about four and a half years.
A major hurdle was removed on 8 July 2024, when the government lifted the de facto onshore wind ban in England. The planning tests that applied specifically to onshore wind were removed, treating it like other energy developments. According to RenewableUK, more onshore capacity has since entered planning in England than in the previous nine years combined, and UK onshore planning submissions reached a record 5,043 MW in 2025.
Contracts for Difference (CfD)
The UK supports renewable energy through Contracts for Difference (CfD) auctions. Generators receive a fixed “strike price” per MWh, indexed to inflation. If the market price is lower, the government pays the difference; if higher, the generator pays back the difference.
In Allocation Round 6 (AR6, 2024), offshore wind secured contracts at £58.87/MWh (2012 prices). Floating wind was awarded at £139.93/MWh (2012 prices), reflecting the higher cost of this newer technology. In Allocation Round 7 (AR7, 2026), fixed-bottom offshore wind prices rose to £65.45/MWh (2012 prices) for England and Wales, and £64.23/MWh (2012 prices) for Scotland. Onshore wind in AR7a was awarded at £51.85/MWh (2012 prices). Compared like for like in 2012 prices, strike prices rose from AR6 for both fixed-bottom offshore (£58.87 to £65.45) and onshore wind (£50.90 to £51.85).
Grid constraints and curtailment
As wind capacity grows, the grid struggles to cope. In 2024/25, total GB balancing costs were £2.7 billion, according to NESO, of which thermal constraint costs were £1.7 billion. Much of Britain’s wind capacity is in Scotland, where the network is constrained. The grid cannot always transport the power, so NESO pays Scottish wind farms to switch off (curtailment) and pays other generators further south, often gas, to turn up.
In 2024/25, wind curtailment accounted for 13% of hypothetical wind output. Modo Energy reported that in 2025, turning down Scottish wind cost about £350 million, while the replacement generation, mostly gas, cost over £1 billion. Modo puts transmission constraint costs at £1.9 billion in 2024/25, using a different definition from NESO’s. This is the biggest immediate challenge for wind energy: building the turbines is easier than building the cables to carry their power.
Advantages and disadvantages of wind energy
Wind energy is not without its critics. Here is a balanced look at the pros and cons, based on the data.
| Feature | Advantages | Disadvantages |
|---|---|---|
| Emissions | Lifecycle emissions are very low. Median onshore wind is 11 gCO2eq/kWh; offshore is 12 gCO2eq/kWh. This is roughly 40 times lower than gas and 70 times lower than coal. | Manufacturing turbines (steel, concrete, fibreglass) does create carbon. However, most studies find the energy payback is less than a year. |
| Cost | IRENA found new onshore wind was the cheapest new renewable electricity worldwide in 2024. | Global costs rose in 2024 (onshore up 3%, offshore up 4% on 2023), and UK strike prices rose between AR6 and AR7. Floating wind is expensive (£139.93/MWh in AR6 and £155.37/MWh in AR7, both in 2012 prices). |
| Land/Space | Turbines take up relatively little ground space. Farming can continue around them. | Offshore wind requires vast seabed areas. Visual impact is significant, especially for large offshore farms visible from the coast. |
| Reliability | Wind often blows when solar does not (e.g. at night or in winter). | Wind is variable: the UK offshore load factor was 48.3% in Q4 2025 but 29.1% in Q2 2025. This requires backup or storage. |
| Wildlife | Low operational emissions. | Birds and bats are killed by blades. RSPB objects to specific projects near seabird colonies. Blade recycling is challenging. |
| Noise | Noise is assessed against fixed limits in planning. | Noise limits (35-40 dB(A) daytime in quiet areas) can restrict development. Some residents report “whooshing” sounds. |
Lifecycle emissions and energy payback Wind turbines have a small carbon footprint. The IPCC (2014) estimates median lifecycle emissions at 11 gCO2eq/kWh for onshore and 12 gCO2eq/kWh for offshore. Most studies find that a wind farm pays back the energy used to build it in less than a year, depending on the site and turbine.
Birds and bats Wind turbines do kill birds and bats. In the US, the Fish and Wildlife Service estimates (as of 2017) that land-based wind turbines cause about 234,000 bird deaths annually, compared to 2.4 billion from cats and 599 million from building glass. These are US figures; there is no equivalent official UK estimate. In the UK, a 2016 University of Exeter study estimated about 194 bat deaths per month across 29 onshore wind farms. The RSPB supports offshore wind in principle but objects to specific sites, such as Berwick Bank, due to nearby seabird colonies.
Blade recycling According to WindEurope, 85-90% of a turbine’s total mass can already be recycled. The blades, made of glass or carbon fibre in a polymer resin, are harder to recycle. WindEurope estimated in 2021 that decommissioned blade waste in Europe would rise to about 52,000 tonnes per year by 2030. At that time, Austria, Finland, Germany and the Netherlands already banned sending blades to landfill.
Noise and visual impact In England, wind farm noise in quiet areas is limited to 35-40 dB(A) during the day and 43 dB(A) at night, or 5 dB above background noise, whichever is higher. The night-time limit was derived from a 35 dB(A) indoor sleep criterion plus an allowance for an open window. The government updated guidance in June 2026, keeping these limits but adding a 5 dB correction for amplitude modulation (the “whoosh” sound). Visual impact is a planning judgement but significant; Hywind Scotland turbines stand up to 253 metres tall from base to tip.
Costs and outlook
IRENA’s figures show onshore wind remained the cheapest new renewable electricity in 2024, although global costs rose slightly on 2023. Offshore wind is more expensive but benefits from larger scale and higher load factors.
Looking ahead, the Clean Power 2030 plan aims for clean sources to produce at least 95% of GB generation by 2030. This will require accelerating the deployment of wind, particularly offshore. The plan also calls for 23-27 GW of battery storage and 4-6 GW of long-duration storage by 2030 to manage variability. The biggest bottleneck is not building turbines, but building the transmission lines to carry the power from Scotland to the south. NESO has projected that balancing costs could peak at about £8 billion in 2030, with savings of up to about £4 billion if key network projects are brought forward.
Frequently asked questions
How much of the UK’s electricity comes from wind power?
In 2025, wind energy generated 86.4 TWh, which was about 29.4% of the UK’s total electricity generation (revised down from a first estimate of 30.0%). In Q1 2026, wind’s share was about 35.5%.
How does a wind turbine actually generate electricity?
Wind turns the rotor blades, which spin a shaft connected to a generator in the nacelle. This mechanical energy is converted into electricity. Modern turbines use gearboxes or direct-drive systems to match the rotation speed to the generator.
What happens to wind turbines when it isn’t windy, or when it’s too windy?
Turbines have a cut-in speed below which they do not generate power. They reach full output at their rated speed. If winds exceed the cut-out speed, the turbines shut down to prevent damage during storms. For the Vestas V163-4.5 MW, for example, cut-in is 3 m/s and cut-out is 24 m/s.
Why are wind farms paid to switch off (constraint payments)?
Much of Britain’s wind capacity is in Scotland, where the network is constrained, but much of the demand is further south. The grid cannot always transport the electricity, so NESO pays wind farms to reduce output (curtailment) and pays other generators, often gas, further south to increase output. Total GB balancing costs were £2.7 billion in 2024/25, of which NESO puts thermal constraint costs at £1.7 billion.
Do wind turbines kill a lot of birds and bats?
They do kill some. A UK study estimated about 194 bat deaths per month across 29 onshore farms. In the US, land-based wind turbines kill an estimated 234,000 birds a year, compared to 2.4 billion from cats; there is no equivalent official UK figure. The main concern in the UK is the impact on seabird colonies near offshore farms.
How long does it take a wind turbine to pay back the carbon used to build it?
Most lifecycle studies suggest wind farms pay back the energy used to build them in less than a year. The median lifecycle carbon emissions are around 11-12 gCO2eq/kWh.
Can I put a wind turbine on my house, and do I need planning permission?
In England, a stand-alone turbine can count as permitted development if it meets strict conditions (e.g. no part higher than 11.1 metres, swept area no more than 3.8 m², first turbine only, compliant with MCS 020, not on designated land). Building-mounted turbines have stricter rules and are only allowed on detached buildings; they may also need building regulations approval. Energy Saving Trust guidance is to consider a turbine only where the average wind speed is 5 m/s or more. Always check with your local planning authority and get a professional wind assessment first.