
Solar energy is no longer a niche technology reserved for remote sites. In the UK, it has become a mainstream part of electricity supply, accounting for 6.9% of total generation in 2025 and setting monthly output records in summer 2026. This guide explains how the technology works, why the numbers have shifted so sharply, and what the government’s 2030 roadmap means for homeowners, businesses and the national grid.
Falling costs, new government targets and catching-up regulation are driving growth. From the legalisation of plug-in balcony solar in 2026 to a legal requirement for solar on new homes in England from 2027, the landscape is changing.
How solar energy works
The physics of sunlight
Solar photovoltaic (PV) panels convert sunlight directly into electricity through the photovoltaic effect. When photons from sunlight strike a semiconductor material, usually silicon, they free electrons. A built-in electric field within the cell, known as the p–n junction, pushes these electrons into a circuit, creating direct current (DC).
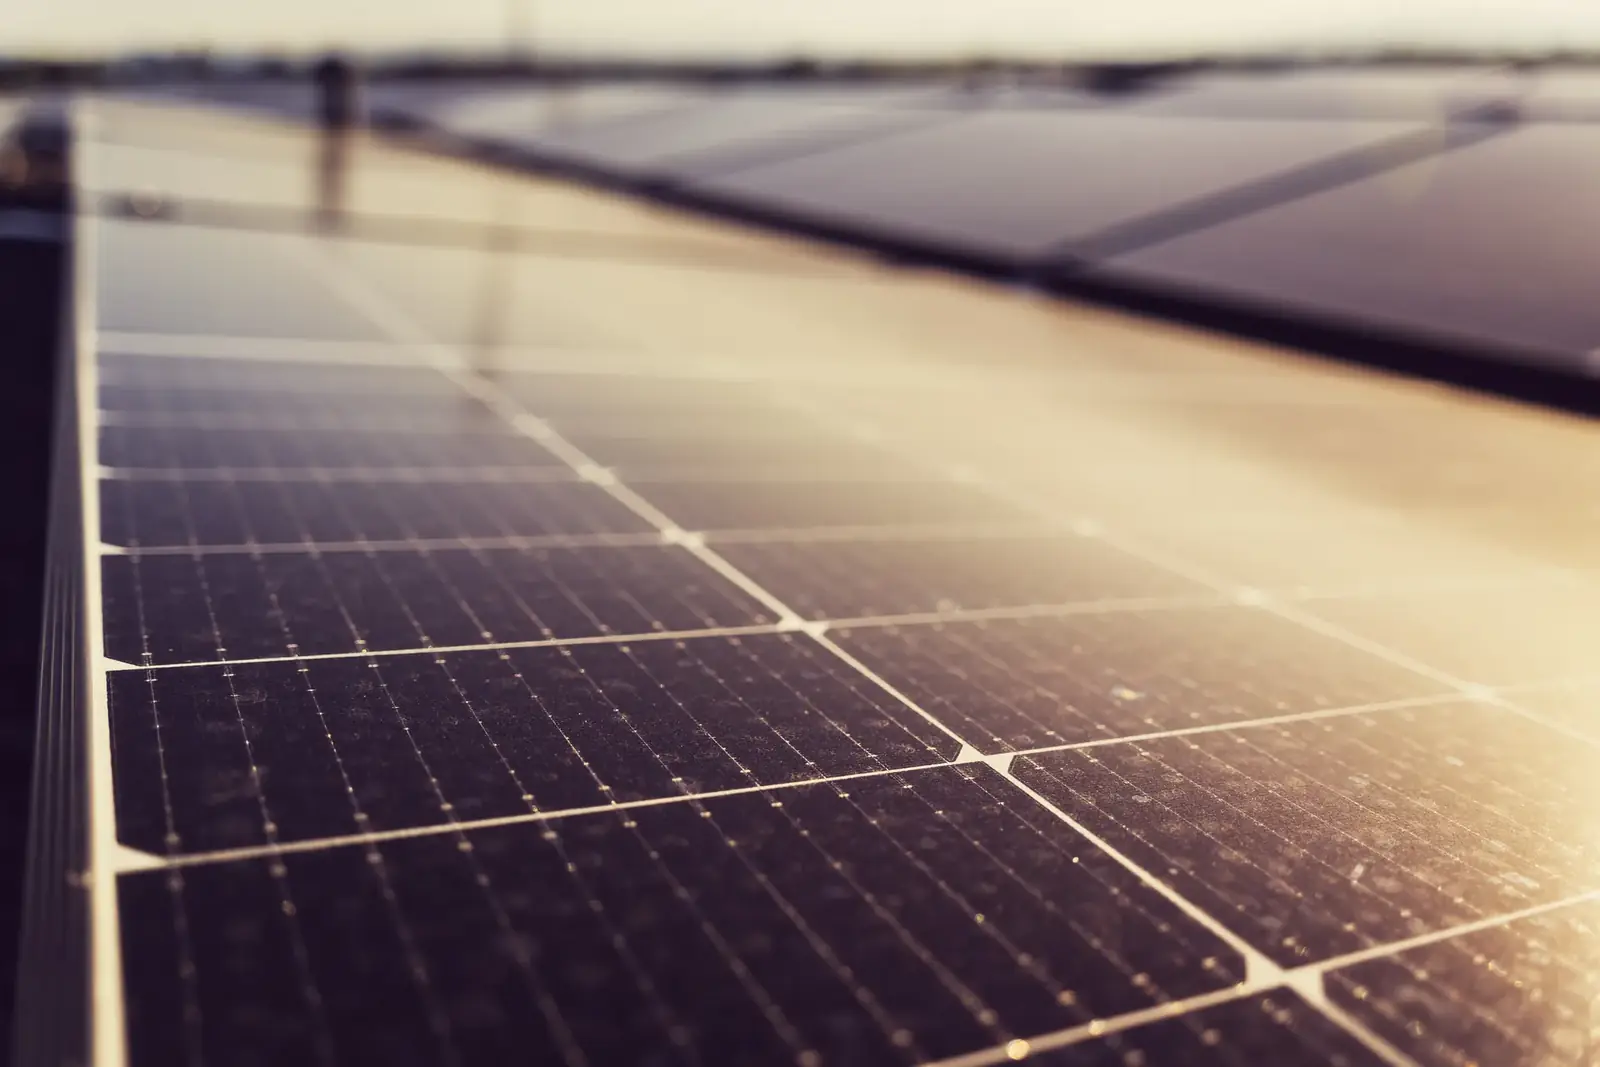
A single cell is one semiconductor wafer. Many cells are wired together behind glass in a frame to form a module, or panel. Multiple panels form an array, which includes mounting hardware, cabling and an inverter. The inverter is critical: it converts the DC from the panels into alternating current (AC), which is what household appliances and the national grid use. Microinverters and power optimisers can be installed at panel level to reduce energy losses caused by shading on individual panels.
Solar panels do not need direct sunlight to function. The Energy Saving Trust says cells generate electricity under cloud cover, albeit at reduced output. Solar thermal is a different technology; it uses collectors to heat a fluid for hot water rather than generating electricity.
Cell types and efficiency
The market has consolidated around monocrystalline silicon. In 2025, global module production was approximately 706 GWp, with monocrystalline silicon accounting for 690 GWp, according to Fraunhofer ISE. Polycrystalline technology has effectively disappeared from the market, and thin-film technologies such as cadmium telluride (CdTe) hold a market share of just 2–3 per cent.
Efficiency has improved significantly. Commercial monocrystalline modules have risen from about 17% to just under 25% over the last decade. Laboratory records for cells of at least 1 cm² are higher, with perovskite-on-silicon tandem cells reaching 35.2% and single-junction perovskite cells reaching 26.9%. For context, silicon usage per watt has fallen from about 16 g/Wp in 2004 to about 2.0 g/Wp in 2024.
The global picture
Solar energy is now a major and fast-growing source of global electricity. In 2025, an estimated 698 GW of new PV capacity was installed worldwide, according to IEA PVPS, bringing cumulative capacity to nearly 3 TW. China accounted for around 60% of these new installations.
According to Ember, solar produced a record 2,778 TWh in 2025, a 30% increase on 2024. This output met 75% of the rise in global electricity demand. For the first time, solar overtook wind generation. Renewables as a whole reached 33.8% of global generation, surpassing coal. On Ember’s figures, solar supplied roughly 8.7% of global electricity in 2025; IEA PVPS puts PV at about 12% of electricity consumption, measured on a different basis.
Costs have fallen in tandem with scale. IRENA reports that the global weighted-average levelised cost of electricity (LCOE) for new utility-scale solar PV was USD 44/MWh in 2025. Since 2010, this cost has dropped by 89%. More than 90% of utility-scale renewable projects commissioned in 2025 were cheaper than the lowest-cost new fossil-fuel alternative.
Solar energy in the UK
Capacity and installations
At the end of August 2026, total installed capacity stood at 23.2 GW across 2.13 million installations (provisional DESNZ figures). This represents a 9.0% increase on August 2025. The 12 months to August 2026 saw 291,000 new installations, the highest number in any 12-month period since 2012.
Domestic installations dominate the numbers but not the capacity. While homes account for the majority of installations, they represent only 30% of total capacity. At August 2026, domestic capacity was 7,088 MW across 1.76 million domestic installations. Ground-mounted and standalone systems account for at least 38% of capacity (8.8 GW), and DESNZ estimates they make up roughly 59% of total capacity once unaccredited sites are included.
Generation and records
Solar generation is highly dependent on weather. According to the government’s Digest of UK Energy Statistics (DUKES 2026), solar PV generated a record 20.1 TWh in 2025, up 34% on 2024. This constituted 6.9% of total UK generation. 2025 was the sunniest year since the series began in 2001. By contrast, 2024 was the least sunny year in that series, with generation of 14.4 TWh, a 5.0% share of generation according to DUKES 2025 (later revised to about 5.3%).
On 23 April 2026, solar output in Great Britain passed 15 GW for the first time, peaking at about 15–16 GW depending on the NESO data release. NESO’s current dataset shows 16,289 MW at midday, 43.4% of the GB generation mix, still the highest half-hour on record. According to Carbon Brief analysis, solar generated 8.8 TWh across June, July and August 2026, a 23% increase on summer 2025.
The 2030 target and roadmap
The government’s Solar Roadmap, published in June 2025, sets out an ambition of 45–47 GW of total solar capacity by 2030. The starting point was 18 GW at Q1 2025. With 23.2 GW installed by August 2026, roughly half the target remains to be achieved.
The indicative mix for 2030 under current policy is:
- about 60–65% large-scale solar
- about 20% domestic rooftop
- about 15–20% commercial rooftop and ground-mount
The roadmap estimates around 35,000 direct and indirect jobs in Great Britain by 2030, up from about 17,000 today. A new Solar Council, chaired jointly by government and industry, oversees delivery.
Major projects
Cleve Hill Solar Park in Kent is currently the UK’s largest operational solar farm at 373 MW. It came online in summer 2025 and was the first solar project consented as a Nationally Significant Infrastructure Project (NSIP). Other projects granted development consent include Mallard Pass (about 350 MW) and Gate Burton Energy Park (500 MW) in July 2024, and Springwell Solar Farm in Lincolnshire in April 2026. Botley West in Oxfordshire (840 MW) is awaiting a decision, due by 10 November 2026, and would be among Europe’s largest.
Land use
Solar farms currently occupy about 0.1% of total UK land. Reaching the 2030 target would require up to about 0.4% of land. While this is a small fraction of the total, large-scale projects often face local opposition and delayed decisions.
Policy and support
Several key policies and incentives are shaping the market:
- Plug-in solar: From 27 August 2026, plug-in solar is legal in Great Britain. Devices are limited to 800 W maximum AC output, and the interim product specification allows one device per ring circuit, with no multi-way adaptors or extension leads.
- Future Homes Standard: From 24 March 2027, followed by a 12-month transition, new dwellings in England will legally require renewable electricity generation, in practice solar panels. Approved Document guidance says the requirement is met by panels with an area equal to 40% of the dwelling’s ground-floor area; no panels are needed if the roof cannot produce about 720 kWh a year.
- VAT: Installing solar panels in residential accommodation is zero-rated for VAT until 31 March 2027. Since 1 February 2024, home batteries, including those retrofitted to existing systems, also qualify. From 1 April 2027, the rate reverts to the reduced 5% rate.
- Smart Export Guarantee (SEG): Launched on 1 January 2020, this scheme requires suppliers with at least 150,000 domestic customers to pay small-scale generators in Great Britain for exported electricity. Rates vary widely, from 1p to 25p per kWh (Solar Energy UK, May 2026). The average tied tariff paid 14.54p/kWh in the year to March 2025, while untied tariffs averaged 4.39p/kWh.
Advantages and disadvantages
| Feature | Details |
|---|---|
| Emissions | Lifecycle emissions for rooftop PV are 26–60 gCO2eq/kWh (IPCC AR5, 2014 data). This is significantly lower than gas (410–650) or coal (740–910). |
| Energy payback | Panels made in Europe and installed in northern Europe repay their manufacturing energy in about 1.1 years (Fraunhofer ISE). |
| Intermittency | UK solar load factor was 11.1% in 2025. Output is highly seasonal, with Q2 generation far exceeding Q4. |
| Land use | Requires space. Reaching the 2030 target needs up to about 0.4% of UK land. |
| Cost | Median costs for 0–4 kW systems were £1,595/kW in 2025/26. Payback periods range from 9 to 12 years depending on location and usage (Energy Saving Trust). |
| Recycling | Panels are covered by the WEEE Regulations, which place producer responsibility on manufacturers and importers. Fraunhofer ISE says further research is needed to make recycling more cost-effective. |
| Supply chain | China holds over 90% of global manufacturing capacity. The Solar Roadmap highlights forced-labour risks in polysilicon production. |
The low capacity factor (9–11% in the UK in 2024–2025) means that while solar contributes a large share of peak summer generation, it provides a smaller share of total annual energy than wind, whose 2025 load factors were 24.1% onshore and 36.4% offshore. For a fuller comparison of emissions and costs, see solar energy vs fossil fuels.
Costs and outlook
Home solar costs
According to the Energy Saving Trust, the average home solar system is around 4.5 kWp and costs around £7,600 to install, covering 20–30 m² of roof space. DESNZ data from April 2025 to March 2026 shows a median cost of £1,595/kW for systems up to 4 kW, and £1,546/kW for systems between 4 and 10 kW. After adjusting for inflation, median costs per kW fell 7% and 9% respectively compared with 2024/25.
New-build installations are cheaper per kilowatt (£1,506/kW mean) than retrofits (£1,817/kW mean). The Energy Saving Trust puts battery costs at around £5,000 to £8,000.
Generation and savings
PVGIS estimates suggest a south-facing 4 kWp system at optimal tilt would produce roughly 3,500–4,500 kWh a year, depending on location. In London, a 1 kWp system produces about 1,020 kWh a year; in Manchester, about 890 kWh. Real UK systems average less than these best-case figures.
Payback periods vary by region. The Energy Saving Trust estimates payback times of 9 years in London, 10–11 years in Manchester, and 11–12 years in Stirling. These figures assume export payments and July 2026 fuel prices. Panels typically last 25 years or more, though inverters usually need replacing after around 12 years.
Global and domestic outlook
IRENA expects solar costs to fall further to 2035, though more slowly. In the UK, the 45–47 GW target implies adding roughly 22–24 GW by 2030, far above the 2.7 GW added in 2025, so deployment would need to speed up.
Frequently asked questions
How much does it cost to put solar panels on a house in the UK in 2026?
DESNZ data for 2025/26 puts the median cost of a 4–10 kW system at around £1,546 per kW. The Energy Saving Trust says an average 4.5 kWp system costs around £7,600. It puts batteries at around £5,000–£8,000.
Do solar panels work in the UK’s cloudy weather, and how much electricity will they produce?
Yes. Panels generate electricity even under cloud cover, though output is lower. PVGIS estimates suggest a south-facing 4 kWp system at optimal tilt could produce roughly 3,500–4,500 kWh a year; real systems average less. The national load factor was 11.1% in 2025.
Is there still 0% VAT on solar panels and batteries, and when does it end?
Yes, installing solar panels and batteries in homes, including retrofitted batteries, is zero-rated for VAT until 31 March 2027. From 1 April 2027, the rate returns to 5%.
How does the Smart Export Guarantee work, and how much will I be paid for exported electricity?
The SEG requires larger suppliers in Great Britain to pay for exported electricity at rates they set. Rates vary from 1p to 25p per kWh. The average tied tariff was 14.54p/kWh in 2024/25, while untied tariffs averaged 4.39p/kWh.
Do I need planning permission for solar panels, and are plug-in (balcony) solar panels legal now?
Most domestic rooftop panels are permitted development in England, though listed buildings are excluded and rules differ elsewhere in the UK. Plug-in solar became legal in Great Britain on 27 August 2026, limited to 800 W devices.
How much of the UK’s electricity comes from solar?
In 2025, solar generated 20.1 TWh, which was 6.9% of total UK generation. Output was a record, and 2025 was the sunniest year since the series began in 2001.
Will new homes have to have solar panels under the Future Homes Standard?
Yes, in England. From 24 March 2027, with a 12-month transition, new dwellings must include renewable electricity generation, typically solar panels covering 40% of the ground-floor area, unless the roof cannot produce about 720 kWh a year.
Are solar panels really green, given manufacturing emissions, recycling and forced-labour concerns?
IPCC figures (2014 data) put lifecycle emissions for rooftop PV at 26–60 gCO2eq/kWh, far lower than fossil fuels. European-made panels in northern Europe repay their manufacturing energy in about 1.1 years, and WEEE recycling rules apply. However, over 90% of manufacturing capacity is in China, raising supply chain and labour concerns that the government addresses in its Solar Roadmap.