
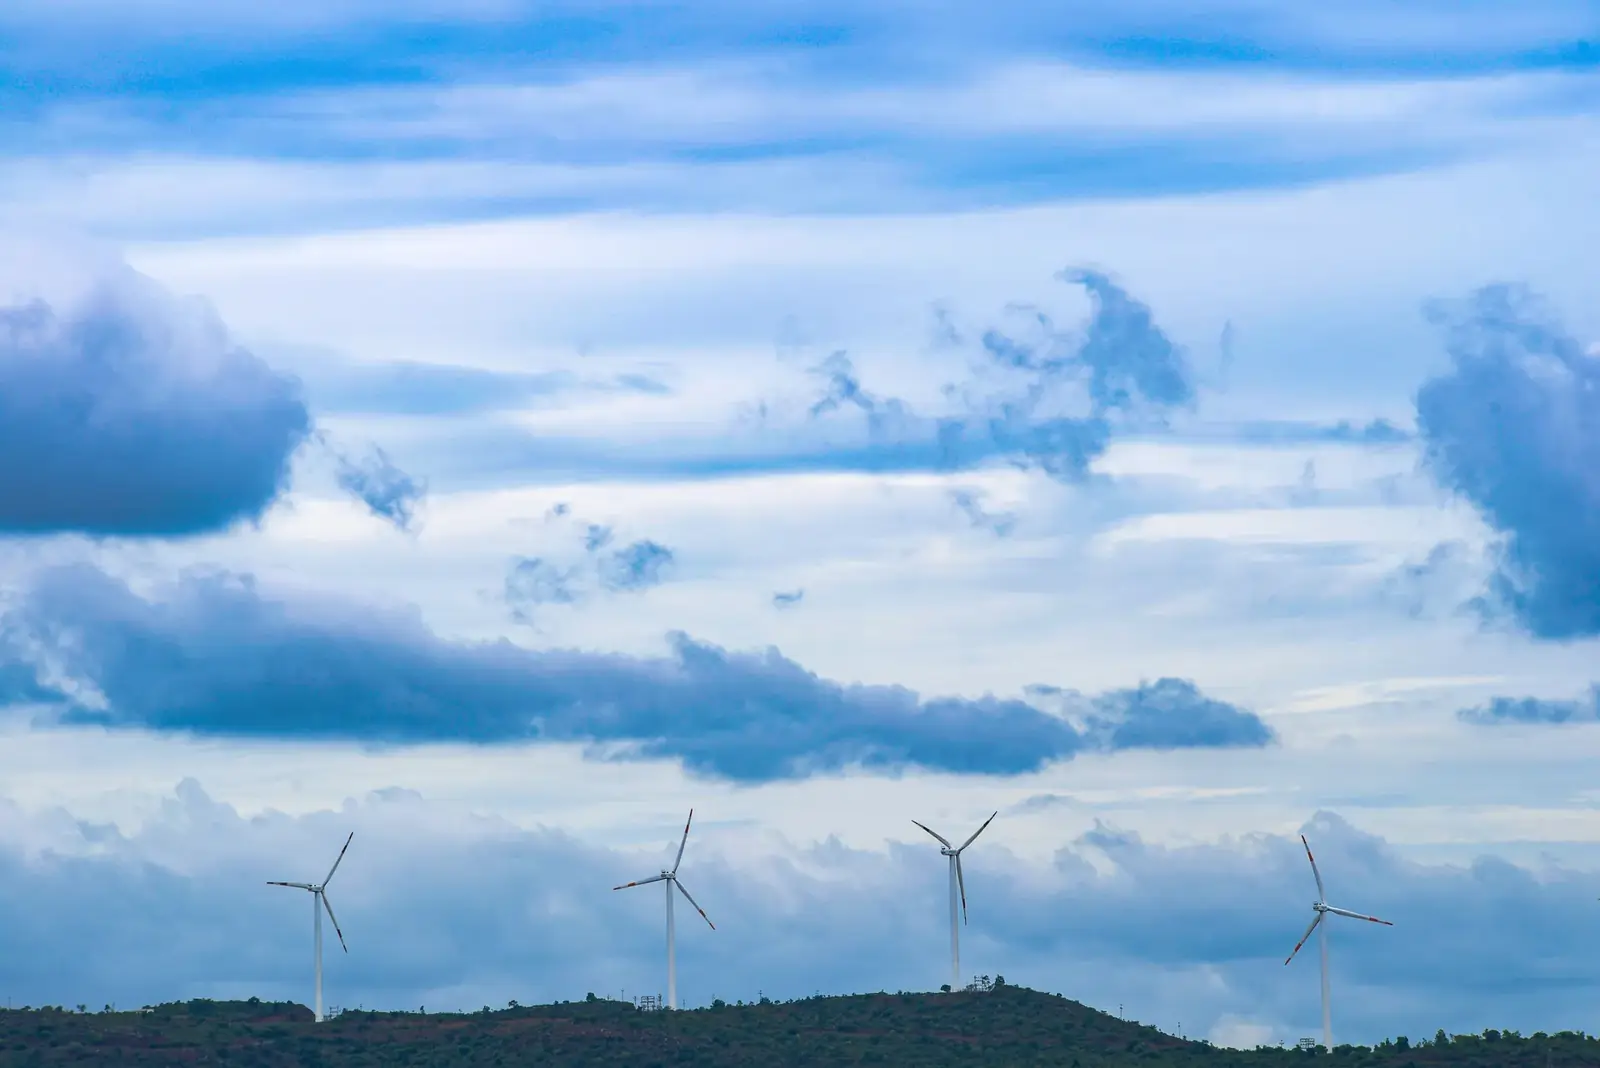
You find a wind farm where the wind is strong, consistent and cheap to capture. Wind farm site selection is not a guess; it is an engineering exercise that balances physics, geography and planning rules. Developers look for exposed sites such as smooth, rounded hilltops, open plains and open water, then prove the wind is reliable enough to pay back the investment.
The process starts with measuring the wind, usually for at least a year, and checking whether the site can connect to the electricity grid. It then moves through environmental checks, community engagement and government consent. In the UK, recent planning reforms have changed how onshore wind is judged, while offshore leasing has opened up new areas for development.
How wind farm site selection works
The physics of location
Wind is not uniform, and a small change in location can make a large difference to output. If wind speed doubles, power output increases eightfold. This cubic relationship means that even slightly windier spots generate much more energy.
However, the cubic relationship stops at the turbine’s rated wind speed, where maximum output is reached. Above that point, extra wind adds no extra power, which is one reason developers value consistent wind as well as strong wind.
Measuring the resource
To prove a site is viable, developers carry out a wind resource assessment. Traditionally this means meteorological masts equipped with anemometers and wind vanes. Data should cover at least one year to capture seasonal variation, and records shorter than five years can still give inaccurate energy estimates because of year-to-year variation.
Remote sensing is gaining acceptance onshore. Light Detection and Ranging (LiDAR) and Sound Detection and Ranging (SoDAR) use lasers and sound waves to measure wind profiles. For offshore sites, floating LiDAR has become the standard approach for measurement campaigns.
Raw data is rarely enough. Short on-site records are corrected against long-term reference stations, often nearby airports, usually by linear regression in a “measure-correlate-predict” approach. This helps the data represent long-term averages rather than a single windy or calm year. Because modern hub heights are usually 80 metres or more, measured speeds are then extrapolated to hub height using the power law or log law.
Screening thresholds
Not every windy spot is suitable, and sources disagree on the commercial threshold. The US Energy Information Administration gives a rule of thumb of at least 5.8 metres per second (m/s) annual average for utility-scale turbines, while the US Department of Energy treats about 6.5 m/s or more at 80 metres height as generally suitable. For small or domestic turbines, the Energy Saving Trust advises that the local annual average wind speed should be at least 5 m/s.
Spacing and layout
Turbines cannot be placed too close together. Turbulence from one turbine creates a “wake” that reduces output from any turbine downwind. To limit this, turbines are typically spaced several rotor diameters apart.
Real-world examples
Offshore scale
The Hornsea 2 project, fully operational since August 2022, uses 165 Siemens Gamesa turbines of 8 MW each. That gives a capacity of about 1.32 GW, and Ørsted says it powers over 1.4 million UK homes. Further offshore, the Dogger Bank project will total 3.6 GW across three phases. Located 131–196 km off the North East coast of England, it uses GE Haliade-X turbines of up to 14 MW. First power was generated in October 2023, and the project is still under construction.
Onshore leaders
On land, Whitelee on Eaglesham Moor near Glasgow is the UK’s largest onshore wind farm. It comprises 215 turbines with a capacity of up to 539 MW, which ScottishPower says is enough for over 350,000 homes. In Shetland, the Viking wind farm, 443 MW, was commissioned in 2024. According to government statistics, the largest new onshore wind farm in 2025 was the 86 MW Limekiln project in Scotland.
Floating innovation
Where water is too deep for fixed foundations, floating platforms are used. Hywind Scotland, about 29 km off Peterhead, was the world’s first commercial floating wind farm: 30 MW from five 6 MW turbines, commissioned in 2017. More recently, the Crown Estate’s Round 5 leasing in the Celtic Sea offers up to 4.5 GW of floating capacity. Equinor and Gwynt Glas were named preferred bidders in June 2025, and Ocean Winds for the third site in November 2025.
What the numbers say
Capacity and generation
By the end of the second quarter of 2026, the UK had installed 16,833 MW of onshore wind and 16,733 MW of offshore wind. In that quarter, wind supplied 27.9% of UK generation, more than gas at 26.8%, and renewables set a record 55.8% share of the electricity mix. You can follow the current picture on our live GB electricity mix page.
Efficiency
Output varies by location. In 2025, the load factor (also called the capacity factor) for onshore wind was 26.0% in Wales and 24.1% in both Scotland and England. Offshore wind performed better, with England recording 41.3%. Government statisticians note that these figures reflect regional wind speeds, plus curtailment and maintenance.
The grid bottleneck
A major constraint in site selection is grid connection. Before recent reforms, the first-come-first-served queue had grown to more than 700 GW of generation and storage, roughly four times what Great Britain needs in 2030. In December 2025, the National Energy System Operator (NESO) confirmed a reformed pipeline of 283 GW of generation and storage, prioritising projects that were “ready” and aligned with Clean Power 2030. By June 2026, offers had been issued to 58% of transmission and distribution projects in the pre-2030 pipeline (713 of 1,223).
Community benefits
To secure local support, developers often provide community benefits. In England, voluntary government guidance (updated July 2025) expects onshore wind projects of 5 MW or more to provide at least £5,000 per MW per year, indexed to inflation. Payment can be cash or in kind and should start within 12 months of first generation. In 2025 the government consulted on making community benefits mandatory across wind, solar and other technologies.
Limitations / honest assessment
Measurement uncertainty
Wind data is never perfect. The Global Wind Atlas provides a useful initial screen at 250-metre resolution, but it is not precise enough for final decisions, and the World Bank warns that in steep terrain the modelling is more uncertain and likely to overestimate mean wind speeds on ridges and hilltops. The UK’s older NOABL database gives estimates for each 1 km square, is no longer updated and does not model sea or valley breezes; a 2013 University of Reading study found it tends to overestimate speeds in urban areas. This is why on-site measurement remains essential.
Environmental trade-offs
Turbines are not without impact. Government planning guidance notes the risk of collision between moving blades and birds or bats (see our piece on renewables and bird populations). Heritage settings and cumulative landscape effects are also assessed, and aviation radar is a common constraint: developers should consult the MOD for turbines 11 metres or taller to blade tip.
Noise is another constraint. In its response of 19 June 2026, the government said ETSU-R-97 “should no longer be applied” and replaced it with updated guidance. The new rules keep the same structure: the limit is the greater of a fixed lower limit (35–40 dB by day, 43 dB at night) or 5 dB above background noise. A 5 dB amplitude-modulation correction is retained, and the proposed single 37 dB limit was dropped.
Shadow flicker is manageable. In the UK, only properties within 130 degrees either side of north, relative to the turbines, can be affected. Turbines can be controlled to avoid flicker, and planning conditions can secure this mitigation.
The “best” location myth
Flat plains are often described as ideal, but that is misleading. What matters is exposure: the US EIA lists the tops of smooth, rounded hills, open plains, open water and mountain gaps that funnel and intensify wind, and wind speed increases with height above the ground. For small turbines, UK advice is to avoid nearby buildings, trees or hills that cause turbulence. The “best” location is ultimately the one that balances strong, steady wind with reasonable construction costs, grid access and few planning hurdles.
The UK angle
Planning reforms
On 8 July 2024, the government ended the “de facto ban” on onshore wind by removing the wind-only tests that required sites to be identified in a plan and backed by community support. Under the revised National Planning Policy Framework (NPPF), published on 17 August 2026 and updated on 29 September 2026, “substantial weight” is given to the benefits of renewable energy. Applicants should not be required to demonstrate need, and proposals outside plan-identified areas are assessed against national policy as a whole. There is no statutory minimum distance from homes in England.
For large projects, onshore wind was brought back into the Nationally Significant Infrastructure Projects (NSIP) regime from 31 December 2025, with a threshold of more than 100 MW. In England, these larger wind farms are examined by the Planning Inspectorate and decided by the government, not local councils.
Devolved nations
In Scotland, Scottish Ministers decide onshore generating stations over 50 MW, with applications handled by the Energy Consents Unit. The Scottish Government’s 2022 policy statement sets an ambition of 20 GW of onshore wind by 2030. In Wales, the Significant Infrastructure Projects (SIP) system replaced the Developments of National Significance regime on 15 December 2025; onshore wind of 50 MW or more falls under it.
Offshore leasing
Offshore sites are leased rather than chosen freely. The Crown Estate’s Round 5 in the Celtic Sea offers up to 4.5 GW for floating wind. ScotWind, run by Crown Estate Scotland, selected 17 projects totalling 25 GW in 2022.
Frequently asked questions
Where are wind turbines usually located?
On exposed, windy sites: rounded hilltops, open moorland and plains, coasts and open sea. In the UK, Scotland produced 64% of onshore wind generation in 2025, while England produced 79% of offshore wind generation, mostly off its east coast.
What is the best place for a wind turbine, and what wind speed does it need?
The best places are exposed sites with little turbulence. For utility-scale turbines, US screening thresholds range from about 5.8 m/s (EIA) to 6.5 m/s at 80 metres (DOE). The Energy Saving Trust says small turbines need about 5 m/s or more.
How is wind speed measured when assessing a wind farm site?
Developers use meteorological masts with anemometers, or remote sensing tools like LiDAR and SoDAR (floating LiDAR offshore). Data is collected for at least one year, corrected against long-term reference stations and extrapolated to hub height.
How do I check the wind speed at my location in the UK?
You can use the Global Wind Atlas or the UK’s NOABL database as a starting guide. These are estimates only. The Energy Saving Trust recommends a professional on-site assessment over a full year at the exact location.
What are the main criteria for wind farm site selection in the UK?
Key criteria include wind resource quality, grid connection (through NESO’s reformed queue), the planning route (more than 100 MW goes through the NSIP regime in England, with 50 MW thresholds in Scotland and Wales), noise and shadow flicker limits, radar and aviation constraints, and impacts on wildlife, heritage and landscape. More on how turbines generate power is in our guide to wind energy.
Where are the UK’s biggest wind farms?
The largest onshore farm is Whitelee in Scotland (539 MW). Among the biggest offshore projects are Hornsea 2 (about 1.32 GW, operational) and Dogger Bank (3.6 GW, still under construction).