
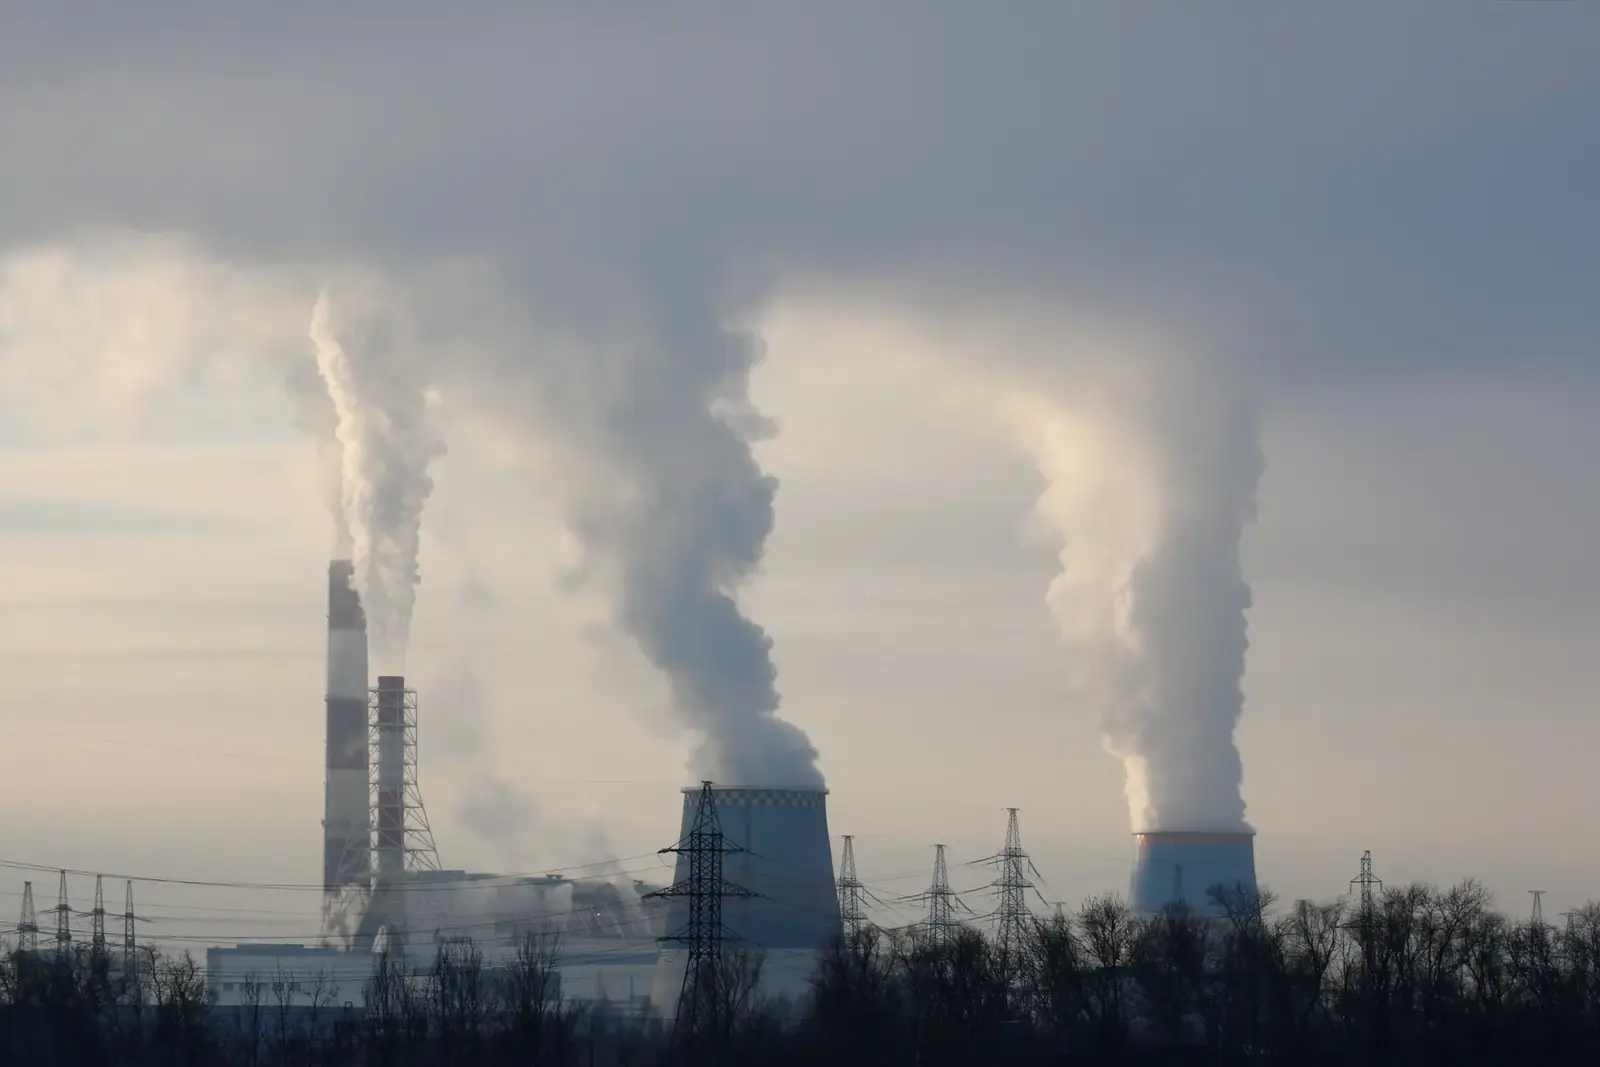
No, solar energy is not a fossil fuel. Fossil fuels (coal, oil and natural gas) are the remains of ancient organisms, burned to release stored carbon. Solar power converts sunlight directly into electricity or heat with no fuel and no combustion.
Beyond that, the debate over solar energy vs fossil fuels centres on cost, emissions and reliability. The numbers show a clear shift, though each plays a different role in the grid, and solar cannot replace fossil fuels on its own today.
How it works
Solar photovoltaic (PV) panels, usually made from silicon, convert sunlight into electricity; solar thermal systems use sunlight to produce heat. Fossil fuel power stations burn coal, gas or oil to raise steam or drive turbines.
Solar panels burn no fuel and produce no combustion emissions in operation, but only generate in daylight. Fossil plants must keep burning fuel, but can run whenever needed.
Real-world examples
In 2025, the UK generated a record 20.1 TWh of solar electricity, up 34% on 2024. The last coal plant, Ratcliffe-on-Soar, closed on 30 September 2024, making 2025 the first year in the published series with no coal-fired generation.
On 23 April 2026, solar output in Great Britain hit a record. Depending on the National Energy System Operator (NESO) data release, it reached about 15-16 GW at midday: pv magazine read 15,158 MW (42% of the mix), while the current NESO dataset shows 16,289 MW (43.4%).
Globally, solar generated a record 2,778 TWh in 2025, up 30% on the year, according to Ember. That is about 8.7% of global electricity; the IEA PVPS programme’s “more than 10%” figure is measured differently, on a capacity-based potential basis. An estimated 698 GW of new PV capacity was installed worldwide in 2025.
What the numbers say
Emissions
Life-cycle emissions for solar are far lower than for fossil fuels. The IPCC’s 2014 assessment (AR5) gives these median figures in grams of CO2 equivalent per kilowatt-hour (gCO2eq/kWh):
- Rooftop solar PV: 41
- Utility-scale solar PV: 48
- Gas combined cycle (CCGT): 490
- Coal: 820
On these medians, utility-scale solar emits about one-tenth as much as gas CCGT and about one-seventeenth as much as coal per kWh over its life. The IPCC data is from 2014. Panels now use far less silicon per watt (from about 16 g/Wp in 2004 to about 2.0 g/Wp in 2024, according to Fraunhofer ISE), so current solar figures are likely lower.
Carbon Brief estimated the UK grid’s carbon intensity at about 126 gCO2/kWh in 2025, up 2% on 2024. Globally, IRENA estimates that renewables avoided 8.4 gigatonnes of CO2 in 2025.
Cost
According to IRENA, the global weighted-average levelised cost of electricity (LCOE) for new utility-scale solar PV was USD 44/MWh in 2025, after an 89% fall since 2010. Onshore wind was USD 33/MWh and offshore wind USD 78/MWh. IRENA puts new gas power at USD 50-60/MWh where gas is cheap and towards USD 100/MWh in high-price markets.
In the UK, the Department for Energy Security and Net Zero (DESNZ) estimates that large-scale solar PV commissioning in 2035 would have an LCOE of £44/MWh (range £36-50), in 2024 prices. A new gas CCGT commissioning in 2030 and running at a 93% (baseload) load factor would cost £109/MWh in 2024 prices, using the department’s 2025 carbon price assumptions.
These numbers need context. DESNZ itself says technologies with different roles are “complements, rather than substitutes”, so a direct comparison of their LCOEs “is not appropriate”. LCOE also excludes system costs such as grid connections and balancing.
Reliability and load factors
Solar’s load factor in the UK was 11.1% in 2025, a year of record sunshine. Gas CCGT load factors were 29.7% in 2025. This is not a technical ceiling: DESNZ describes UK CCGTs as “mid merit order”: they are turned up and down to fill gaps, so their load factor reflects how often they are needed, not a physical limit. Solar’s low load factor is set by daylight and weather.
Solar output varies by season: the UK generated 8.4 TWh from solar in Q2 2026 but 2.1 TWh in Q4 2025. Gas can be switched on when needed; solar cannot. That is why the UK’s Clean Power 2030 plan pairs solar with wind, 23-27 GW of batteries and 4-6 GW of long-duration storage by 2030, with gas kept as backup.
Limitations / honest assessment
Solar requires land, materials and grid infrastructure. Solar farms cover about 0.1% of UK land today, and reaching the 45-47 GW target would need up to about 0.4%. Rooftop solar uses no extra land; domestic installations alone account for 30% of UK solar capacity (August 2026).
Manufacturing panels, often in fossil-powered factories, is why lifecycle emissions are not zero. Even so, Fraunhofer ISE says PV systems made in Europe and installed in northern Europe repay their manufacturing energy in about 1.1 years.
PV panels have been covered by UK WEEE Regulations since 1 January 2014. Fraunhofer ISE notes that modules can be recycled, but “further research and development is needed” to make the process more thorough and cost-effective.
Supply chains are concentrated. China holds over 90% of global solar PV manufacturing capacity, and Xinjiang is estimated to produce a third to a half of the world’s solar-grade polysilicon.
The UK angle
The UK has moved away from coal but still relies on gas. In 2025, gas generated 31.8% of UK electricity, still the single largest source, while wind generated 29.5% and solar 6.9%. All fossil fuels together made up 32.3% of generation, and renewables reached 52.1%. The live GB electricity mix shows how wind, solar and gas shares change through the day.
That 52.1% is the electricity share only. Renewables supplied just 16.8% of the UK’s gross final energy consumption in 2025, because heating and transport still mostly run on gas and oil. Oil is a negligible source of UK electricity; it is mainly used for transport and heating. The UK’s net import dependency for energy was 43.3% in 2025, and over 90% of energy imports were oil and gas.
The 2022 gas crisis showed this exposure. Ofgem’s price cap for a typical dual-fuel household was set at £3,549 a year from 1 October 2022, although the government’s Energy Price Guarantee limited a typical bill to £2,500. For October-December 2026, the cap rose 4%, which Ofgem attributed to higher wholesale gas prices “caused by the ongoing conflict in the Middle East”.
Solar helps reduce this exposure at system level. Once built, it has no fuel cost, and IRENA describes renewables as “counter-cyclical” because their value rises when fossil prices rise. For more on the technology itself, see our guide to solar energy and what it means for the UK.
Frequently asked questions
Is solar energy a fossil fuel?
No. Fossil fuels are ancient organic matter burned for energy; solar converts sunlight directly into electricity or heat. UK official statistics classify solar PV as a renewable source.
Is solar power cheaper than gas in the UK?
On generation cost estimates, yes. DESNZ puts large-scale solar commissioning in 2035 at £44/MWh, against £109/MWh for a new gas CCGT commissioning in 2030 (both in 2024 prices). But DESNZ warns that comparing the LCOEs of technologies with different roles “is not appropriate”, and LCOE leaves out grid and balancing costs. For home installations, costs and savings depend on the property and tariff; check current solar panel grants and incentives in the UK and get quotes from an MCS-certified installer.
How much of the UK’s electricity comes from solar compared with fossil fuels?
In 2025, solar generated 6.9% of UK electricity and fossil fuels (gas, coal, oil) 32.3%. In Q2 2026, solar generated 8.4 TWh, a 12.3% share of UK generation.
Is solar really low-carbon once you count manufacturing?
Yes. The IPCC’s 2014 median lifecycle figure for utility-scale solar is 48 gCO2eq/kWh, compared with 490 for gas and 820 for coal. Energy payback for European-made panels installed in northern Europe is about 1.1 years.
Can solar replace fossil fuels when the sun isn’t shining?
Not on its own. Solar had an 11.1% load factor in the UK in 2025, and its Q4 2025 output was about a quarter of Q2 2026’s. The UK’s Clean Power 2030 plan pairs solar with wind, batteries and long-duration storage, with gas as backup.
Does solar take up more land than fossil fuel power?
Solar farms cover about 0.1% of UK land today, rising to up to about 0.4% if the 45-47 GW target is met. We found no comparable UK figure for gas, so a direct comparison is not possible. Rooftop solar uses no extra land.