
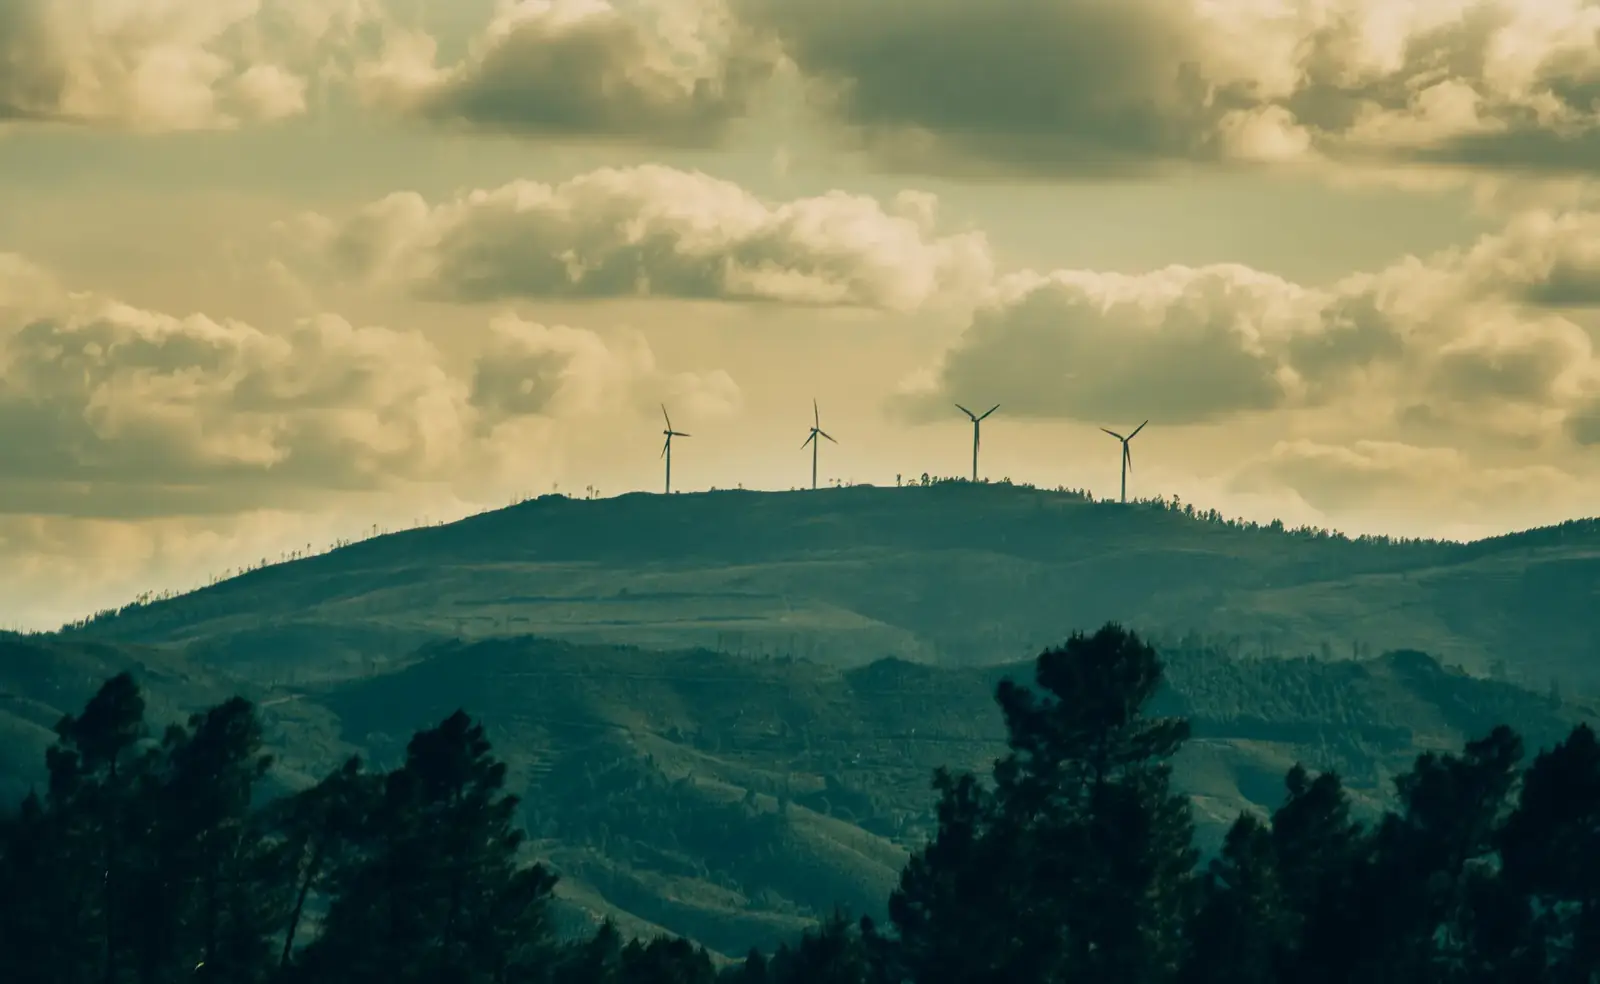
Renewables generated a record 52.1% of UK electricity in 2025, yet the transition is far from complete. The benefits of renewable energy show up clearly in the data: generation costs have fallen sharply and coal has left the power mix. But renewables still supply only 16.8% of the UK’s total final energy use, because heating and transport still run mostly on gas and oil, and the grid’s carbon intensity rose slightly in 2025.
This article sets out the evidence: where the UK stands today, the numbers on cost and carbon, and the trade-offs around intermittency, grid balancing, land and supply chains.
Where the UK is now
The UK electricity system has changed fast. In 2025, according to DESNZ, wind supplied about 29-30% of generation, gas remained the single largest source at 31.8%, nuclear fell to 12.2% (its lowest output since the 1980s because of outages) and solar contributed 6.9%. Low carbon sources (renewables plus nuclear) made up 64.3% of generation, slightly down from 64.7% in 2024.
The end of coal is a milestone. The UK’s last coal-fired power station, Ratcliffe-on-Soar in Nottinghamshire, closed on 30 September 2024, and 2025 was the first year in the published data with no coal-fired generation. Coal fell to 1% of total UK energy demand in 2025, from 17% in 2000. Fossil fuel generation in 2025 was 94.9 TWh, a level last seen in the mid-1950s, when demand was a third of today’s.
Even so, the UK’s net import dependency was 43.3% in 2025, and over 90% of energy imports are oil and gas. UK gas production fell 3% in 2025 to a 21st-century low. While electricity has changed most, overall energy security is still tied to global fossil fuel markets.
How clean is the grid?
Despite record renewables, the grid’s carbon intensity rose slightly in 2025. Carbon Brief analysis found each kWh of UK electricity in 2025 was linked to about 126 gCO2, up 2% from the record low of 124 g in 2024, because coal’s exit was partly replaced by gas and nuclear output was low.
The government’s Clean Power 2030 Action Plan aims to cut GB generation carbon intensity from 171 gCO2e/kWh in 2023 to well below 50 g in 2030. That figure is on a different basis from Carbon Brief’s, which includes imports, so the two should not be compared directly.
Benefit: lower emissions over the whole life cycle
Renewables cut emissions across the whole life of the technology. According to the IPCC’s 2014 assessment (AR5), median lifecycle emissions are 11 gCO2eq/kWh for onshore wind and 12 for offshore wind, compared with 490 for gas combined cycle and 820 for coal. Utility-scale solar PV is 48 and rooftop solar 41.
On those medians, wind’s lifecycle emissions are about 40 times lower than gas and about 70 times lower than coal; utility solar is roughly 10 times lower than gas. Panels now use far less silicon than in 2004 (about 16 g/Wp then, about 2.0 g/Wp in 2024, according to Fraunhofer ISE), so current solar figures are likely lower, though the IPCC medians have not been updated.
Fraunhofer ISE estimates that PV systems made in Europe and installed in northern Europe repay their manufacturing energy in about 1.1 years. Globally, IRENA estimates renewables avoided 8.4 gigatonnes of CO2 and USD 480 billion in fossil fuel costs in 2025.
Benefit: cost
The economics have shifted. IRENA’s cost report for 2025 found onshore wind was the cheapest new source of power worldwide, at a global weighted-average levelised cost of electricity (LCOE) of USD 33/MWh. Solar PV followed at USD 44/MWh and offshore wind at USD 78/MWh. More than 90% of utility-scale renewable projects commissioned in 2025 produced power more cheaply than the cheapest new fossil-fuel alternative. New gas plants, by contrast, got dearer: IRENA puts gas LCOE near USD 100/MWh in high-gas-price markets and USD 50-60/MWh where gas is cheap.
Since 2010, LCOE has fallen 89% for solar PV, 71% for onshore wind and 63% for offshore wind, according to IRENA. The installed cost of a four-hour utility-scale battery fell about 30% in 2025 to around USD 140/kWh.
In the UK, Contracts for Difference (CfD) auctions set guaranteed prices for new projects. In 2012 prices, onshore wind secured £50.90/MWh in Allocation Round 6 (2024) and £51.85/MWh in AR7a (February 2026). Fixed offshore wind reached £58.87/MWh in AR6 and £65.45/MWh in AR7 (England and Wales, January 2026). In 2024 prices, the AR7 offshore price is £91.20/MWh and the AR7a onshore price £72.24/MWh.
LCOE covers the generator only. It excludes the extra grid, storage and balancing costs that variable renewables bring.
Benefit: energy security and price stability
Gas price spikes feed into bills, partly because UK electricity prices are often set by gas power stations. During the 2022 gas crisis, as reported at the time, Ofgem’s price cap for a typical dual-fuel household paying by direct debit was set at £3,549 a year from October 2022 (up 80%) and £4,279 from January 2023. The government’s Energy Price Guarantee limited a typical bill to £2,500 a year from October 2022. More recently, Ofgem raised the cap by 4% for October to December 2026, citing higher wholesale gas prices “caused by the ongoing conflict in the Middle East”; it says prices remain well below the 2022 peak.
Once built, renewables have no fuel cost. IRENA describes their value as “counter-cyclical”: it rises when fossil prices rise. Most new UK wind and solar is on CfDs: generators are paid a fixed strike price, and when market prices are above it they pay the difference back.
Benefit: health and air quality
The UK Health Security Agency says air pollution is one of the greatest environmental risks to public health in the UK, associated with an estimated 29,000 to 43,000 deaths a year (2023 report). These are modelled attributable deaths, not death certificates, and they cover all sources. With coal power gone, most of this pollution now comes from road transport, home heating (including wood burning), industry and farming, not power stations.
So renewables help mainly by replacing combustion in transport and heating, through EVs and heat pumps. The Department for Transport says the shift to electric vehicles “will remove the source of exhaust emissions that cause thousands of premature deaths from poor air quality every year”. One caveat: biomass is classed as renewable but involves burning, and its air quality and carbon accounting are debated.
Trade-offs
Intermittency
Wind and solar output vary with weather and season. In 2025, UK solar had a load factor of 11.1%, onshore wind 24.1% and offshore wind 36.4%. Offshore wind’s load factor was 48.3% in Q4 2025 but 29.1% in Q2 2025, and solar generated 8.4 TWh in Q2 2026 against 2.1 TWh in Q4 2025.
To manage this, the Clean Power 2030 Action Plan plans for 23-27 GW of batteries and 4-6 GW of long-duration storage by 2030, with gas kept as backup.
Grid and balancing costs
Keeping the grid balanced costs money. NESO reports GB balancing costs of £2.7bn in 2024/25, up 10% on the previous year, including £1.7bn of thermal constraint costs. Balancing charges were about 3.4% of an average household bill, roughly £3 a month.
In 2024/25, 13% of potential wind output was curtailed, mainly because much wind is in Scotland and the grid to England is congested: NESO pays Scottish wind farms to switch off and gas plants further south to switch on. NESO projected balancing costs could peak at about £8bn in 2030, with savings of up to about £4bn if key network projects are brought forward.
Land use and minerals
According to the government’s Solar Roadmap, solar farms cover about 0.1% of UK land, and reaching 45-47 GW of solar by 2030 would need up to about 0.4%. Large projects such as Botley West (840 MW, Oxfordshire) face local opposition; a decision is due by 10 November 2026. Wind turbines take little ground space but have visual, noise and wildlife impacts assessed through planning, and in England onshore wind was effectively blocked by planning rules from 2015 until 8 July 2024.
Supply chains are another concern. The IEA says the main risk is now over-concentrated refining: Indonesia leads for nickel and China for other key energy minerals, and the top rare earth refiner held 85% of the market in 2025. IRENA says China holds over 90% of global solar PV manufacturing capacity, and Xinjiang is estimated to produce a third to a half of the world’s solar-grade polysilicon. On recycling, WindEurope (2021) says 85-90% of a wind turbine’s mass can be recycled, though blades are the hard part; PV panels have been covered by UK WEEE rules since 2014.
What individuals can do
You can switch to a “green” tariff, with caveats. Suppliers can label a tariff green or “100% renewable” if they hold enough REGO certificates (Renewable Energy Guarantees of Origin) to cover their customers’ use, even if some of the power they buy comes from fossil fuels. In 2021, the government said about 9 million British households were on green tariffs. REGOs are matched annually, not by the hour. DESNZ says it will take powers to change the REGO regime “when parliamentary time allows”, but no new green tariff labelling rules are in force. Ask whether your supplier owns generation or buys power directly from named UK renewable generators.
Generating your own power is another option. The Energy Saving Trust puts an average 4.5 kWp rooftop solar system at about £7,600, with payback of about 9-12 years depending on region; actual savings depend on your home and tariff, and exported power can be paid for under the Smart Export Guarantee. Plug-in (balcony) solar up to 800 W has been legal in Great Britain since 27 August 2026.
Electrifying heating and transport is the next step. The Boiler Upgrade Scheme supports heat pumps, and the Electric Car Grant offers up to £3,750 off eligible cars; check current scheme rules on GOV.UK. The shift is also creating green energy jobs.
Frequently asked questions
How much of the UK’s electricity comes from renewables?
Renewables generated 52.1% of UK electricity in 2025 and a record 55.8% in Q2 2026. But they supplied only 16.8% of total final energy use in 2025, because heating and transport still rely mostly on gas and oil.
Is renewable energy really cheaper than gas?
On generation cost alone, usually yes. IRENA found onshore wind was the cheapest new source globally in 2025 at USD 33/MWh, while new gas approached USD 100/MWh in high-gas-price markets. These figures exclude grid, storage and balancing costs; GB balancing costs were £2.7bn in 2024/25.
What happens when the wind doesn’t blow and the sun doesn’t shine?
Other sources fill the gap. Even in a record year for renewables, gas supplied 31.8% of UK power in 2025. The Clean Power 2030 plan adds 23-27 GW of batteries and 4-6 GW of long-duration storage by 2030, with gas kept as backup.
Are wind turbines and solar panels really low carbon once you count manufacturing?
Yes. IPCC (2014) median lifecycle emissions are 11 gCO2eq/kWh for onshore wind and 41-48 for solar PV, against 490 for gas and 820 for coal. Fraunhofer ISE estimates European-made panels installed in northern Europe repay their manufacturing energy in about 1.1 years.
Is a “100% renewable” tariff really green?
It depends. Suppliers can label tariffs green by holding REGO certificates, matched annually, even if some power they buy comes from fossil fuels. No new labelling rules are in force yet. Ask whether your supplier owns generation or buys directly from renewable generators.
What are the downsides of renewable energy?
Intermittency, grid balancing costs (£2.7bn in 2024/25), land use, and supply chains concentrated in China for solar manufacturing and mineral refining. Most of a wind turbine can be recycled, but blades remain hard to recycle.