
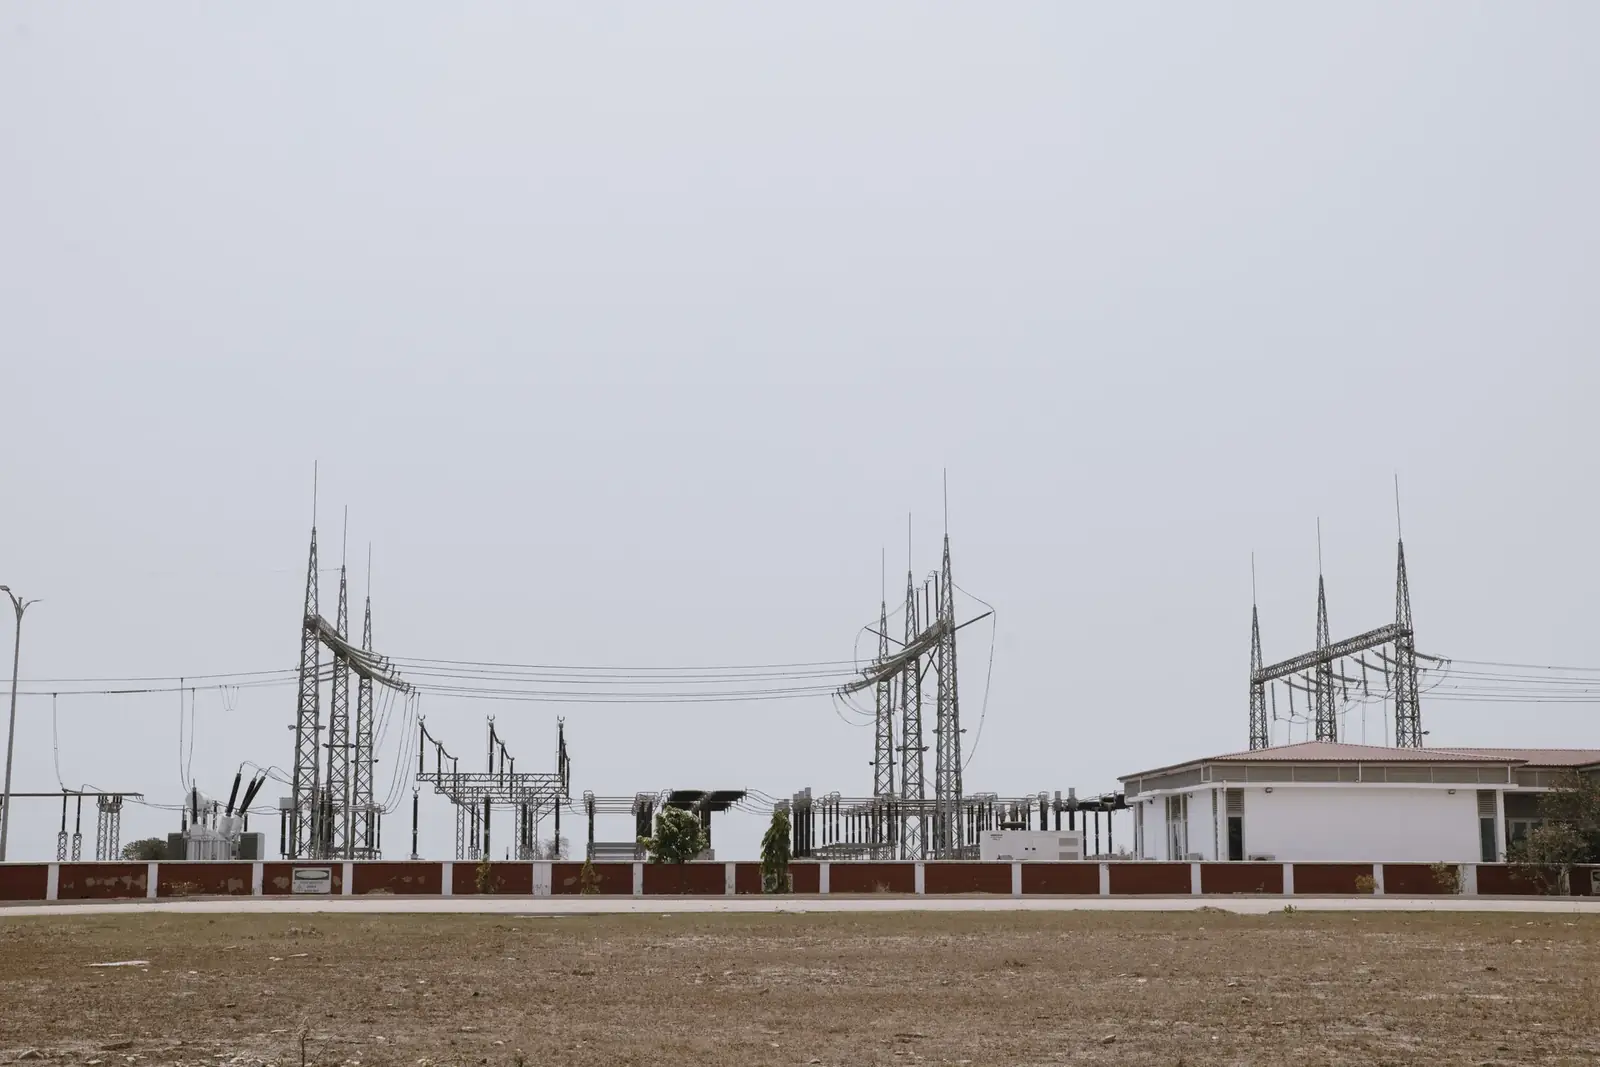
A smart grid uses digital communications, sensors, smart meters and automated control so that power and data flow in both directions, letting the network manage local generation such as rooftop solar, batteries and electric vehicles, as well as flexible demand. It is not a single piece of hardware but a way of running the whole network intelligently.
A microgrid is a small, bounded section of a network with its own generation that can be controlled as one unit and, crucially, can keep running when cut off from the main grid. A smart microgrid applies the same digital controls to that local system. The difference is structural: one is a method for managing the entire system, the other is a physically distinct local network.
Smart grid vs microgrid: the difference
The two terms are often confused, but the distinction is clear. A smart grid is the intelligence layer applied to existing transmission and distribution networks. It relies on two-way communication, advanced metering and automated control. A microgrid is a physical entity: according to the US Department of Energy, “a group of interconnected loads and local energy resources within clearly defined electrical boundaries that acts as a single controllable entity with respect to the grid.”
In practice, a smart grid helps the national system cope with variable renewables such as solar energy and wind energy. A microgrid provides local resilience. The DOE notes that it can connect to and disconnect from the main grid, known as “islanding”, so it can keep its local area supplied when the main grid is unavailable. Microgrids face their own technical and regulatory hurdles, covered below.
How it works
The grid is shifting from one-way delivery to a two-way flow of power and data. Three elements matter most in Great Britain: smart meters, demand flexibility and distribution system operators (DSOs).
Smart meters are the foundation. At the end of June 2026 there were 57.5 million meters in homes and small businesses in Great Britain, according to government statistics. About 42 million of these, or 72%, were smart and advanced meters. Some 37.2 million smart meters were operating in smart mode (92% of smart meters), while 3.1 million were running in “traditional” mode. By mid-June 2026, over 11.3 million smart meters had moved to half-hourly settlement, and market-wide half-hourly settlement is on track to cover all meters by May 2027. This is what makes time-of-use tariffs and paid demand shifting practical.
Demand flexibility is the response mechanism. Instead of always building new power stations or cables to meet peak demand, the system can pay consumers to shift their usage. The National Energy System Operator (NESO), which took over from National Grid ESO, runs the national system and balancing, and buys flexibility from providers who can reduce or shift load when needed.
In Great Britain the local wires are run by distribution network operators (DNOs), which have been taking on DSO roles: actively managing local flows and buying flexibility instead of only building new cables. According to the government’s Clean Flexibility Roadmap (July 2026 update), Ofgem will report on DSOs’ use of flexibility in the current price control (ED2) by autumn 2026, and business plans for the next one (ED3) are due in December 2026.
Real-world examples
The Isle of Eigg in Scotland is a fully off-grid microgrid, switched on on 1 February 2008. It is a hybrid system combining about 110 kW of hydro, 24 kW of wind and 170 kW of solar PV, about 300 kW in total. According to Eigg Electric, its battery bank can supply the island for up to 24 hours, and renewables have provided around 95% of its electricity since 2008. Two 64 kW diesel generators cover the rest. Supply is capped at 5 kW per household and 10 kW per business, showing that an off-grid microgrid can work but needs careful load management.
Orkney took a grid-connected smart grid approach. SSEN’s Active Network Management, set up in 2009 and described as Britain’s first smart grid, let 21.8 MW of extra renewable generation connect by automatically curtailing output when cables would otherwise overload. By 2012 it had reached its limit, and new connections were suspended for a time. A later project, ReFLEX Orkney, launched in 2019 with £28.5 million of funding. It aimed to link about 60 MW of island renewables with 20–25 MW of local demand using batteries, smart electric vehicle charging and flexible heating.
Internationally, the Brooklyn Microgrid in New York, run by LO3 Energy, hosted the first peer-to-peer solar energy trade between neighbours in Park Slope in 2016, using a private blockchain platform. New York utility regulation was the main obstacle to its expansion, according to a 2017 Heinrich Böll Foundation analysis.
What the numbers say
NESO’s Demand Flexibility Service (DFS) is the main national scheme for paid demand shifting. Launched in 2022, it pays households and businesses to cut or shift electricity use at peak times, typically 4pm to 7pm. In winter 2024/25 (27 November 2024 to 28 March 2025), nearly 2 million households and businesses were registered. DFS was used 44 times, reducing or shifting 3,917.7 MWh of demand at a cost of £1.2 million, and avoiding more than 620 tonnes of CO2, according to NESO. The previous winter, 2023/24, it was used 16 times, shifting 3,759 MWh at a cost of £11.9 million. Some 28 providers have registered with the service since it launched. Since 27 November 2024, DFS has run year-round as an “in-merit” market tool, used when it is cheaper than the alternatives. From 9 April 2026 it added two-way flexibility, zonal procurement and a 0.1 MW entry threshold, and from 7 October 2026 it began procuring constraint management actions.
Local flexibility markets are also expanding. The Energy Networks Association (ENA) says DNOs tendered 31 GW of flexibility and contracted 9 GW in 2024, and that bill payers saved more than £300 million through flexibility that year. The tendered figure is not comparable with earlier years because the method changed (for 2023 the ENA reported 6.4 GW tendered and 4 GW contracted), and other ENA material frames the 2024 figures differently. At company level, Electricity North West dispatched 4,349.30 MWh of flexibility in the 2024/25 regulatory year.
Grid-scale storage is growing. Battery capacity reached around 7.5 GW at the end of 2025, with a record 2.3 GW added during the year. Long-duration storage, mostly pumped hydro, stood at 2.8 GW / 23.9 GWh in June 2026. Interconnectors linking Britain to other countries provide 10.3 GW, with 12–14 GW targeted by 2030 under the Clean Power 2030 Action Plan.
Limitations / honest assessment
Smart grids and microgrids face technical, financial and regulatory constraints.
Microgrids can struggle with capacity limits. The Isle of Eigg caps household supply and still relies on diesel for around 5% of its electricity. When local generation exceeds local demand and export capacity, curtailment becomes necessary: on Orkney, about 60 MW of generation sits alongside 20–25 MW of demand, and Active Network Management capacity ran out by 2012. Local flexibility has a ceiling; beyond it, more physical network capacity is needed.
Cost and complexity are further factors. Storage and control systems add cost, and a microgrid must switch between grid-connected and island mode without disrupting power quality, which requires suitable protection and controls.
Batteries are also not always used when they could be. In the first half of 2026, NESO’s skip rate for batteries was 38%: battery offers that were cheaper than alternatives were bypassed by the control room. NESO’s interim target is to bring this down to 30%.
The UK angle
The government’s Clean Flexibility Roadmap, first published in July 2025 and updated on 13 July 2026, includes a NESO target of 750 MW of industrial and commercial flexibility in its markets by 2030 and cites NESO modelling suggesting an eight-fold increase in clean flexibility capacity between 2024 and 2050. The Warm Homes Plan, announced in January 2026, allocates £15 billion to upgrade up to 5 million homes by 2030.
NESO is also reforming the grid connection queue. Before reform, the queue exceeded 700 GW, having grown tenfold in five years. On 8 December 2025, NESO confirmed a reordered pipeline prioritising 283 GW of generation and storage and 99 GW of transmission-connected demand. By 1 October 2026, NESO said more than 75% of the offers needed to support the 2030 energy system had been issued.
Balancing costs show why flexibility matters. In 2024/25, total balancing costs reached £2.7 billion, up from £2.5 billion the previous year, according to NESO’s 2025 Annual Balancing Costs Report. Thermal constraint costs, mainly paying Scottish wind farms to switch off when the network cannot carry the power south, accounted for £1.7 billion. NESO projects balancing costs could peak at around £8 billion a year in 2030, and estimates up to about £4 billion could be saved in 2030 if critical network projects are brought forward.
Frequently asked questions
What is the difference between a smart grid and a microgrid?
A smart grid is a way of running the whole electricity network intelligently, using digital communications, sensors and smart meters so that power and data flow in both directions. A microgrid is a small, bounded section of network with its own local generation that can be controlled as a single unit. Crucially, a microgrid can disconnect from the main grid and keep running, known as “islanding”.
What is a smart microgrid?
A smart microgrid is a microgrid that uses the same digital controls as a smart grid: communications, sensors and automated control to manage local generation, storage and demand, while interacting with the main grid when connected.
How many smart meters are there in Great Britain?
At the end of June 2026 there were about 42 million smart and advanced meters in Great Britain, 72% of all 57.5 million meters in homes and small businesses. Some 37.2 million smart meters were operating in smart mode.
How does the Demand Flexibility Service pay households to use less power at peak times?
NESO’s Demand Flexibility Service pays households and businesses, through registered providers, to reduce or shift electricity use at peak times, typically between 4pm and 7pm. In winter 2024/25, nearly 2 million households and businesses were registered; the service was used 44 times, shifting or reducing 3,917.7 MWh at a cost of £1.2 million. It now runs year-round and is used when it is cheaper than the alternatives.
What are the main challenges for microgrids?
Capacity limits can restrict use, as on the Isle of Eigg, where household supply is capped at 5 kW. Curtailment occurs when local generation exceeds local demand and export capacity, as in Orkney. Regulation can hold back expansion, as with the Brooklyn Microgrid. Microgrids also need storage and control systems, and must switch between grid-connected and island modes without disrupting power quality.
Why does Britain pay billions to balance the grid?
Supply and demand must be matched at every moment, and the system operator pays generators and others to adjust when they are not. In 2024/25 balancing costs reached £2.7 billion. Of this, £1.7 billion was thermal constraint costs: paying generators, mainly Scottish wind farms, to switch off when the network could not carry the power south. NESO projects costs could peak at around £8 billion a year in 2030.